With the Flow Georgia Watersheds Report for June 20 to June 26, 2022
By Gillian Ward
Table of Contents - Click on location links to go to information
Gulf of Mexico Flows. 5
1 Gulf North. 5
1a Tennessee River Watershed. 5
Groundwater Monitoring. 5
1b Coosa River Watershed. 5
Groundwater Monitoring. 7
1c Tallapoosa River Watershed. 8
2 Gulf West 8
2a Chattahoochee River Watershed. 8
Groundwater Monitoring. 9
2b Flint River Watershed. 9
Groundwater Monitoring. 10
3 Gulf Southwest 10
3a Ochlockonee River Basin. 11
Groundwater Monitoring. 11
3b Suwannee River Watershed. 11
- 11
- 12
Groundwater Monitoring. 12
4 Atlantic Central 13
4a Oconee River Watershed. 13
Groundwater Monitoring. 13
4b Ocmulgee River Watershed. 14
Groundwater Monitoring. 15
4c Altamaha River Watershed. 15
4d Satilla River Watershed. 16
4e St. Marys River Watershed. 16
Groundwater Monitoring. 17
Atlantic East 17
5a Savannah River Watershed. 17
Savannah River 18
drains an area of 9850 sq miles from Columbia County to Effingham County. The flow: 18
- 18
Groundwater Monitoring. 18
5b Ogeechee River Watershed. 19
Groundwater Monitoring. 19
Report Key. 20
Find information on the river flows in your watershed here each week. WTGA reports USGS Streamflow data captured in a single weekly snapshot, including flow volume and stage, as per selected USGS streamflow monitoring data. The report captures your watershed flows from headwaters to outlet as of the date indicated. Systems reporting much above normal or high flows (above 90th percentile, or in other words, in the top 10% of flow volume and velocity for that system) are shown in boldface; flows in action stage or flood stage appear in red. Flows can change rapidly, check your local station at the USGS WaterWatch Current Streamflow for real-time values.
WTGA gathers data from US EPA, Georgia EPA, USGS WaterWatch, National Weather Service, National Oceanographic and Atmospheric Administration (NOAA) sources; our accuracy is dependent on these sources.
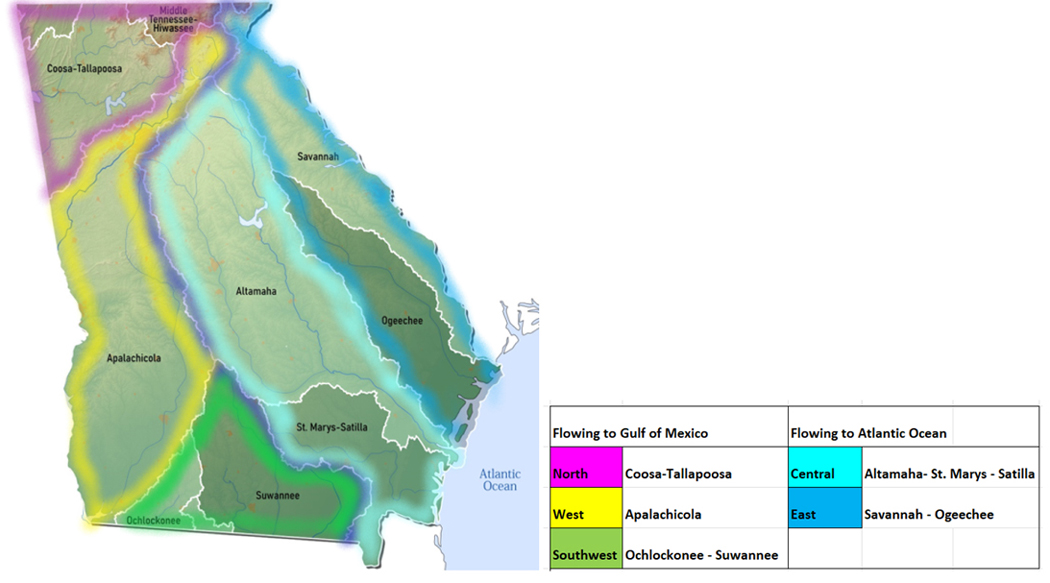
Georgia’s landscape sends rainfall in two directions from the height of land, also known as the drainage divide: southwest to the Gulf of Mexico, or southeast to the Atlantic Ocean.
Find your location in one of the five sections of our report.
Gulf of Mexico Flows

1 Gulf North
1a Tennessee River Watershed
The Tennessee River collects rainfall and runoff for the Ohio River system, which joins the Mississippi and empties out into the Gulf of Mexico. While no part of the Tennessee River itself passes through Georgia, there are tributary creeks originating in north Georgia that cross the state line and join up with Tennessee waters.
- Lookout Creek drains an area of 149 sq miles of Dade County. The flow is monitored near New England, rated normal, 56.60% above mean at 61.0 cfs and 3.59 ft deep as of 06/18/22
- Chattanooga Creek drains an area of 6 sq miles of Walker County. The flow is monitored at Flintstone: 73.18% above mean, 13.1 cfs and 2.99 ft deep as of 06/18/22
- West Chickamauga Creek drains an area of 148 sq miles in Catoosa County. The flow near Lakeview: 95.28% above mean, 91.7 cfs and 1.01 ft deep as of 06/18/22
- South Chickamauga Creek drains an area of 169 sq miles in Catoosa County. The flow near Ringgold: 67.62% above mean, 63.2 cfs and 3.93 ft deep as of 06/18/22
Groundwater Monitoring Station
Walker County Groundwater station ID#0001 water level is 10.73 ft below surface as of March 3rd, 2022.
1b Coosa River Watershed
The Coosa River is a collection of several tributary rivers gathered from northwest Georgia. At the beginning of this system, the Conasauga River and Coosawattee Rivers join up to form the Oostanaula River. The Oostanaula in turn joins flow with the Etowah River system to form the Coosa River. The Coosa runs west into Alabama where it merges with the Tallapoosa River across the state line in Alabama, forming the Alabama River, eventually reaching the Gulf of Mexico.
(Confusion alert** Watch for another river by the same name (Chattooga) in northeast Georgia! These two are not the same.)
- Conasauga River drains an area of 8.24 sq miles in Murray County. The flow at Tilton is below normal, 38.41% above mean, 244 cfs and 2.83 ft deep, as of 06/18/22
- Mill Creek drains an area of 40 sq miles in Whitfield County. The flow at Dalton is below normal, 74.14% above the mean, 19.5 cfs and 4.20 ft deep, as of 06/18/22
- Coahulla Creek drains an area of 176 sq miles in Whitfield County. The flow near Dalton is 76.21% above mean, 60.9 cfs and 7.72 ft deep, as of 06/18/22
- Coosawattee River drains an area of 831 sq miles in Gordon and Murray Counties. The flow at Pine Chapel is normal 94.17% above the mean, 964 cfs and 5.66 ft deep as of 06/19/22
- Talking Rock Creek drains an area of 119 sq miles. The flow near Hinton is normal, 57.61% above mean at 74.3 cfs, 1.26 ft deep as of 06/19/22
- Holly Creek drains an area of 1602 sq miles in Gordon County. The flow near Chatsworth is below normal, 20.03% above mean at 15.9 cfs and 1.08 ft deep. The water temp is 22.7°C, as of 06/19/22
- Fausett Creek drains an area of 9.99 sq miles in Gilmer County. The flow near Talking Rock is normal, 104.08% above the mean, 12.5 cfs and 1.58 ft deep as of 06/19/22
- Oostanaula River drains an area of 2115 sq miles in Gordon and Floyd Counties. The flow at Resaca is normal, 76.96% above the mean, 1400 cfs and 3.61 ft deep, as of 06/19/22
- Etowah River drains an area of 1634 sq miles in Dawson, Bartow and Cherokee Counties.
- The flow at GA 136 near Landrum is 100.42% above mean at 179 cfs and 2.19 ft deep (flood stage is 14 ft), 21.0°and 24µS/cm;
- at GA9 near Dawsonville is 84.45% above mean at 198 cfs and 4.37 ft deep (flood stage is 13 ft) 21.5°and 28 µS/cm ;
- at Kelly Bridge near Matt is 80.38% above mean at 416 cfs and 1.83 ft deep (flood stage is 19 ft); downstream of I-575 at Canton in Cherokee County is 76.28% above mean at 628 cfs ad 3.42 ft deep (flood stage is 17 ft);
- at Canton is normal, 70.60 % above mean at 685 cfs and 2.41ft deep (flood stage is 16 ft) 24.4 C;
- at Allatoona Dam above Cartersville in Bartow County is below normal, 24.15% above mean at 403 cfs and 1.30 ft deep (flood at 9ft) 19.2°C;
- at Allatoona Dam 690.08 ft deep; at GA61 near Cartersville is 26.02% above mean at 403 cfs and 1.30 ft deep (flood stage is 18 ft);
- near Kingston is below normal, 36.52% above mean at 696 cfs and 3.89 ft deep (floods at 20 ft) as of 06/19/22
· Two Run Creek
- drains an area of 33.1 sq miles in Bartow County. The flow near Kingston is normal, 81.87% above the mean, 19.6 cfs and 1.22 ft deep. (update 06/19/22)
· Oothcalooga River
- drains an area of 62.6 sq miles in Gordon County. The flow at GA 53 spur near Calhoun is 75.11% above mean, and 38.5 cfs and 7.14 ft deep. (update 06/19/22)
- Coosa River drains an area of 4040 sq miles in Floyd County. The flow near Rome is below normal, 53.00% above mean, 2320 cfs and 11.55 ft deep (flood stage is 24 ft). The water temp is 26.2°C. (update 06/19/22)
- Chattooga River (of the northwest) drains an area of 4040 sq miles of northwest Georgia. The flow at Summerville is normal, 67.59% above mean at 122 cfs and 2.41 ft deep (flood stage is 14 ft). (update 06/19/22)
Groundwater Monitoring Station
- Gordon County Groundwater station ID#1601 water level is trending upward, 16.29 ft below surface as of March 9th, 2022.
1c Tallapoosa River Watershed
The Tallapoosa River originates in northwest Georgia, draining an area of Paulding and Haralson counties before crossing the state line and joining the Coosa River, forming the Alabama River.
- Tallapoosa River drains an area of 272 sq miles of Haralson County. The flow at US78 near Tallapoosa is 108.20% above mean at 212 cfs and 2.11 ft deep as of 06/19/22
- Little Tallapoosa drains an area of 245 sq miles of Carroll County. The flow at GA100 near Bowden is 50.16% above mean at 159 cfs 3.48 ft deep; at Carrollton is above normal, 178.85% above mean at 125 cfs and 2.90 ft deep as of 06/19/22
- Cedar Creek drains an area of 65.3 sq miles of Polk County. The flow at Cedar Town is below normal, 57.51% above mean at 45.6 cfs and 0.74 ft deep as of 06/19/22
- Snake Creek drains an area of 35.5 sq miles of Carroll County. The flow near Whitesburg is below normal, 24.11% above mean at 11.2 cfs and 1.77 ft deep as of 06/19/22
- Snake Creek Reservoir drains an area of 34 sq miles in Carroll County. The flow is 56.86% above mean at 13.6 cfs and 3.32 ft deep. The water temp is 25.0°C as of 06/19/22
- Dog River drains an area of 66 sq miles of Douglas County. The flow at GA 5 near Fairplay 94.27% above mean at 38.2 cfs and 3.48 ft deep. The water temp is 23.3°C. 06/19/22

2 Gulf West
2a Chattahoochee River Watershed
The Chattahoochee headwaters form up near Helen, in northeast Georgia in the Appalachian Mountains. From Union County, the Chattahoochee flows southwest, through the capital and then south, forming the state border with Alabama, terminating in Lake Seminole.
- Chattahoochee River drains an area of 8210 sq miles from the northeast to the southwest. The flow
- At Helen is normal, 79.00% above mean at 82.8 cfs and 0.80 ft deep, 18.6°C.;
- at Leaf flow is normal, 78.44% above mean at 247 cfs and 1.98 ft deep;
- at GA100 at Cornelia is normal, 72.40% above mean at 461 cfs and 1.01 ft deep;
- near Fairburn is normal, 54.60% above mean at 1540 cfs and 0.71 ft deep all as of 06/19/22
- Powder Springs Creek drains an area of 23 sq miles of Cobb County. The flow near Powder Springs is 29.74% above mean 4.96 cfs and 1.47 ft deep as of 06/19/22
- Noses Creek drains an area of 44.5 sq miles of Cobb County. The flow at Powder Road is 15.36% above mean at 6.61 cfs and 1.91 ft deep as of 06/19/22
- Sweetwater Creek drains an area of 13.5 sq miles of Cobb County. The flow at Powder Springs is 91.49% above mean at 62.9 cfs and 3.84 ft deep as of 06/19/22
- Nickajack Creek drains an area of 31 sq miles in Cobb County. The flow near Mableton is 38.99% above mean at 13.1 cfs and 1.59 ft deep as of 06/19/22
- Utoy Creek drains an area of 33 sq miles in Fulton County. The flow is unrated, 117.53% above mean at 28.7 cfs and 3.10 ft deep. The water temp is 23.6°C as of 06/19/22
- Nancy Creek drains an area of 26.6 sq miles in the County. The flow at Atlanta is 33.63% above mean at 9.52cfs and 0.58 ft deep. The water temp is 23.8°C as of 06/19/22
Groundwater Monitoring Station
- Cobb County Groundwater station ID#2901 water level is trending upwards 6.7 ft below surface as of April 18, 2022.
2b Flint River Watershed
The Flint River originates south of Atlanta and gathers run-off from 7570 sq miles of Georgia as it traverses the course north to south, flowing west through Alabama to empty in the Gulf of Mexico.
- Flint River drains an area of 7570 sq miles down the west side of the state. The flow near Griffin in Spalding County is below normal, 22.33% above mean at 55.4 cfs and 2.41 ft deep as of 06/19/22
- below Big Branch, Pike County flow is 49.37% above mean at 174 cfs and 4.97 ft deep as of 06/19/22
- at Thomaston, Upson County, flow is below normal, 35.88% above mean at 303 cfs and 3.19 ft deep as of 06/19/22
- near Carsonville in Upson County, flow is normal, 58.53% above mean, 745 cfs and 2.34 ft deep as of 06/19/22
- at GA 26 near Montezuma, Macon County, the flow is normal, 65.23% above mean at 1430 cfs and 2.11 ft deep as of 06/19/22
- at GA 32 near Oakfield in Worth County the flow is above normal, 133.42% above mean at 3590 cfs and 5.37 ft deep as of 06/19/22
- at Albany, Dougherty County, the flow is below normal 53.59% above mean at 1980 cfs and 2.97 ft deep as of 06/19/22
- at Newton in Baker County, the flow is below normal, 50.83% above mean at 2170 cfs and 4.62 ft deep as of 06/19/22
- at Riverview Plantation near Hopeful in Mitchell County, the flow is 62.93% above mean at 2730 cfs and 4.08 ft deep as of 06/19/22
- at Bainbridge, Decatur County the flow is normal, 51.36% above mean at 3110 cfs and 18.65 ft deep (flood stage 22ft). The water temp is 29.2°C as of 06/19/22
Groundwater Monitoring Station
- Baker County Groundwater station ID#5502 water level is trending upwards, 32.30ft below surface as of May 22,2022.

3 Gulf Southwest
3a Ochlockonee River Basin
Ochlockonee River originates in Worth County in southwest Georgia. The Ochlockonee catchment area drains a combined 1400 plus square miles of Georgia landscape before exiting into Florida and emptying into the Gulf of Mexico. Main use is for fishing. Two smaller and separate watersheds within the Ochlockonee basin, the Aucilla and Wards Creek each have their separate channels directly dumping into the Gulf of Mexico (not monitored). The main tributary rivers and creeks are the Little Ochlockonee River, Tired Creek, Telogia Creek and Crooked River (not monitored).
- Ochlockonee River drains an area of 1002 sq miles in Worth, Thomas and Leon counties. The flow
- at GA188 near Coolidge in Thomas County is 2.39% above mean at 1.29 cfs and 1.93 ft deep (floods at 13 ft);
- near Thomasville in Thomas County is below normal, 2.07% above mean flow at 5.87 cfs and 1.73 ft deep (floods at 15 ft);
- near Concord, at the Georgia/Florida border in Leon County is 15.84% above mean at 88.2 cfs and 24.24 feet deep (flood stage is 36 ft). (updated 06/19/22
Groundwater Monitoring Station
- Thomas County Groundwater station ID#4801 water level is trending downwards 193.95 ft below surface as of March 28th 2022.
3b Suwannee River Watershed
The Suwanee River originates in the Okefenokee Wilderness, between State Hwy 122 and Valdosta Highway. The blackwater Suwannee and its major tributaries, the Willacoochee, Withlacoochee, Alapaha and Little Rivers channel run-off from more than 5000 sq miles from parts of twenty counties in Georgia before crossing over into Florida to empty into the Gulf of Mexico.
- Suwannee River drains 1130 sq miles in south-central Georgia. The flow
- above Fargo in Clinch County indicates flow depth of 6.11feet;
- at US 441 at Fargo in Clinch County the flow is normal, 50.98% above mean at 261 cfs and 3.65ft deep. The channel floods at 13 ft in this location. (update 06/19/22)
- Little River drains an area of 776 sq miles in Georgia before joining the Withlacoochee. The Little River is flowing
- at Upper Ty Ty Road near Tifton in Tift County normal, at 1.93% above mean at 0.25 cfs, and -1.55 ft deep;
- near Adel in Cook County is below normal, 2.93% above the mean, 5.91 cfs and 2.49 ft deep (flood stage is 15.9 ft);
- near Hahira in Lowndes is flowing 8.30% above the mean at 13.7 cfs and 1.56 ft deep. Flooding occurs at 15.2 ft at this section of the river. (Update 06/19/22
- Alapaha River drains an area of 1730 sq miles of south-central Georgia.
The flow
- at GA 195/32 near Irwinville in Irwin County is 0.10% above mean at 0.02 cfs and 1 ft deep (flood stage is 9.9 ft);
- near Alapaha is below normal, 1.80% above meat at 1.23 cfs and 0.92 ft deep (flooding occurs at 15.4 ft);
- at Statenville in Echols County is below normal, 14.79% above mean at 73 cfs and 1.30 ft deep. Flood stage is 23.9 ft at this location. (Update 06/19/22)
- Withlacoochee River drains an area of 1480 sq miles. The flow at
- Skipper Bridge Rd near Bemiss in Lowndes County is normal, 8.30 % above mean at 13.7 cfs and 1.56 feet deep (flood stage is 14.7 ft);
- near Valdosta is 3.60 ft deep; at Quitman flow is below normal, 2.79% above mean at 15.3 cfs and 1.77 ft deep (flood stage at 20.5 ft) 29.8°C and 225 µS/cm.;
- near Pinetta, Florida is normal, 27.25% above mean at 271cfs and 6.72 ft deep, (flood stage 26.5 ft) 24.5°C and 273µS/cm. 06/19/22
Groundwater Monitoring Station
- Lowndes County Groundwater station ID#5301water level is trending downwards 126.91 ft below surface as of May 21,2022

4 Atlantic Central
4a Oconee River Watershed
The Oconee headwaters form in Hall County, flowing southeast through Middle and North Oconee Channels to form the Oconee River below Athens. From here the system flows into Lake Oconee, formed by the Wallace Dam and Sinclair Lake formed by the Sinclair Dam. The Oconee flows down from the dams to its confluence Ocmulgee River, eventually emptying into the Atlantic.
- Middle Oconee drains an area of 398 sq miles in Jackson and Clarke Counties before joining the North Oconee stream to form the Oconee River.
- North Oconee drains an area of 275 sq miles of Jackson and Clarke Counties before joining up with Middle Oconee below Athens. The flow
- at Commerce is, 22.19% above mean at 0.69 cfs and 3.05 ft deep (flood stage is 15 ft);
- at Athens flow is normal, 52.18% above mean at 115 cfs and 4.18ft deep (floods at 19 ft) 06/12/22
- Oconee River drains an area of 5110 sq miles of Wheeler, Laurens, Wilkinson, Baldwin, Greene and the above Counties. The flow monitor
- near Penfield in Greene County shows normal flow, 35.11% above mean at 295cfs and 3.33 ft deep (floods at 13 ft);
- at Milledgeville in Baldwin County shows below normal flow, 23.86% above mean at 429 cfs and 7.36ft deep (flood stage 30 ft);
- at Avant Mine near Oconee in Washington County is 23.01% above mean at 444 cfs and 1.88 ft deep (floods at 18 ft);
- near Oconee in Wilkinson County is, 29.84% above mean at 655 cfs and 1.77 ft deep (flood stage 17 ft);
- at Dublin in Laurens County flow is below normal, 30.21% above mean at 775 cfs and 1.79 ft deep (floods at 21 ft);
- near Mt. Vernon in Wheeler County the flow is below normal, 52.60% above mean at 1210 cfs and 3.10 ft deep (floods at 16 ft)
(updated 06/19/22)
Groundwater Monitoring Station
- Green County Groundwater station ID#0201 water level is trending upwards at 2.94 ft below surface as of May 22,2022
4b Ocmulgee River Watershed
Ocmulgee River originates at Jackson Lake, straddling Jasper, Newton and Butts Counties. The Ocmulgee flows south to join the Oconee River, forming the Altamaha River. Jackson Lake is fed by three rivers: South, Yellow and Alcovy Rivers originating in Central Georgia, all part of the Ocmulgee Watershed area.
- South River drains an area of 468 sq miles in Newton, Dekalb and Fulton Counties. The flow
- at Springdale Rd in Atlanta 2.48 ft deep (flood stage 17 ft) 21.7°C and 222µS/cm;
- at Forrest Park Rd in Atlanta, flow is 43.57% above mean at 12.7 cfs and 3.04 ft deep (flood stage 15 ft) 23.8 °C and 187 µS/cm;
- at Flakes Mill Rd near Atlanta in Dekalb County is 29.00% above mean at 41.0 cfs and 2.21 ft deep (flood here at 13 ft) 25°C and 153µS/cm;
- at Klondike Rd near Lithonia in Dekalb County is normal, 42.87% above mean at 119cfs and 5.13 ft deep (flood stage is 12 ft);
- at GA81 at Snapping Shoals in Newton County, the flow is 46.97% above mean at 325 cfs and 6.99 ft deep (flood stage is 12 ft). (Updated 06/12/22
- Yellow River drains an area of sq miles in Dekalb and Counties. The flow
- at Pleasant Hill Rd near Lithonia in Dekalb County is 32.42% above mean at 126 cfs and 1.68 ft deep (floods at 13 ft);
- at Milstead in Rockdale County is normal, 11.40% above the mean, 12.2 cfs and 0.25 ft deep (floods at 13ft);
- at Rocky Plains Rd near Rocky Plains in Newton County, the flow is normal, 38.78 % above mean at 208 cfs and 4.40ft deep (flood stage 18 ft) (update 06/12/22)
- Alcovy River drains an area of 244 sq miles in Newton and Gwinnett Counties. The flow
- at New Hope Rd near Grayson in Gwinnett County is 37.27% above mean at 220 cfs and 10.6ft deep (floods at 9ft) 23.3°C and 87µS/cm;
- above Covington in Newton County the flow is below normal, 30.22% above mean at 48.8 cfs and 2.07ft deep (flood stage is 12 ft)24.7°C and 73µS/cm;
- below Covington in Newton County is 23.44% above mean at 55.2 cfs and 1.66ft deep (floods at 11 ft) (update 06/19/22)
- Little Ocmulgee River drains an area of 316 sq miles in Telfair County. The flow
- at GA149 at Scotland in Telfair County is unrated: 5.78% above mean at 7.56 cfs and 1.34 ft deep (flood stage is 12 ft) (06/12/22)
- Ocmulgee River drains a combined area of 5180 sq miles in central Georgia. The flow
- near Jackson in Butts County is below normal, 33.57% above the mean, 457 cfs and 5.27 ft deep(flood stage 19 ft);
- at Macon in Bibb County is below normal: 37.79% above mean at 682 cfs and 6.20 ft deep (flood stage 18 ft);
- at US341 at Hawkinsville in Pulaski County is below normal: 58.80% above mean at 1270 cfs and 1.75 ft deep (flood stage 20 ft);
- at Abbeville in Wilcox County is normal: 52.90% above mean at 1410 cfs and 1.84 ft deep (flood stage 12 ft);
- at Lumber City in Jeff Davis County is normal: 66.66% above mean at 2260 cfs and 2.26 ft deep (flood stage 15 ft) (updated 06/19/22)
Groundwater Monitoring Station
- DeKalb County Groundwater station ID#4001 water level is trending upwards at 7.81 ft below surface as of May 22, 2022
4c Altamaha River Watershed
The combined flows of the Oconee River system and the Ocmulgee River system form the Altamaha, “the largest free-flowing river on the East coast”, according to the Georgia River Network.
- Altamaha River drains a combined area of 14000 square miles in central Georgia. The flow
- at US221 near Charlotteville in Montgomery County is normal, 64.11% above mean at 3320 cfs and 1.99 ft deep (flood stage 13 ft);
- near Baxley in Appling County flow is normal, 55.80% above mean at 3610 cfs and 3.28ft deep (flood at 11 ft) 28.8 °C;
- at Doctortown in Wayne County flow is below normal, 51.88% above mean at 3720 cfs and 5 ft deep (floods at 12 ft);
- near Everett City in Glynn County flow is normal, 98.34% above mean at 6310cfs and 5.68 ft deep (floods at 13 ft) (updated 06/19/22
- Ohoopee River drains an area of 1110 sq miles in Emanuel and Tatnall Counties. The flow
- at GA 297 near Swainsboro in Emanuel County is 0.65% above mean at 3.61 cfs and 7.26 ft deep (flood stage 18 ft);
- near Reidsville is flowing below normal, 15.19% above mean at 64.9 cfs and 1.71 ft deep (flood stage is reached at 10 ft) (updated 06/19/22)
4d Satilla River Watershed
The Satilla River forms in Ben Hill County and flows south 200 miles to the Atlantic Ocean.
- Little Satilla River drains an area of 659 sq miles in Pierce County. The flow near Offerman is below normal: 52.60% above mean at 1210 cfs and 1.99 ft deep (flood stage is 9ft) (06/19/22
- Satilla River drains an area of 3240 sq miles in south central Georgia to the Atlantic. The flow
- at GA 158 near Waycross in Ware County is, 17.95% above mean flow at 22.2 cfs and 3.05ft deep (flood stage is reached at 14 ft);
- at Waycross is normal at 17.61% above mean at 68.1 cfs and 5.12 ft deep (floods at 16 ft) 30.1°;
- at Atkinson in Brantley County, flow is normal: 27.89% above mean at 328 cfs and 4.54ft deep (flood stage 13 ft); US17
- at Woodbine in Camden County is tidal, currently flowing at -23500 cfs, and -0.87ft deep (flood stage is 4.21 ft) (update 06/19/22)
4e St. Marys River Watershed
St. Marys is a blackwater river originating in the Okefenokee Wilderness area, south-central Georgia. The river flows 130 miles and empties into Cumberland Sound in the Atlantic.
- North Prong St Marys River drains an area of 160 sq miles in Baker County. The flow at Montiac in Bakers County is normal: 48.26% above mean at 48.8 cfs and 5.74 ft deep (flood stage is 12 ft);(update 06/19/22)
- Marys River drains an area of 1480 sq miles in south central Georgia, including Baker, Charlton, and Camden Counties. The flow
- near MacClenny in Florida is normal: 30.80% above mean at 130 cfs and 2.98 ft deep (flood stage is 12 ft);
- at Ferry Landing near Folkston in Charlton County is 1.15 ft deep (flood stage is 7ft); the flow at I-95 near Kingsland in Camden County is tidal, flowing backwards at -17200 cfs and 1.28 ft deep (flood stage is 3.47 ft) (update 06/19/22)
Groundwater Monitoring Station
- Charlton County Groundwater station ID#3801 water level is trending upwards, 67.57 ft below surface as of May 22, 2022.

Atlantic East
5a Savannah River Watershed
The Savannah River originates in South Carolina, formed with the combined flows of the Tugaloo, itself formed by the joining of the Chattooga and Tallulah Rivers, and the Seneca River. The Savannah flows through east Georgia to its outlet at the Atlantic Ocean, taking run-off from an area of 5800 square miles in Eastern Georgia.
- Chattooga River drains an area of 47 sq miles in Rabun County. The flow at Burrells Ford near Pine Mountain is, 69.76% above mean at 91.9cfs and 1.05 ft deep, 19.1ºC (flood stage is 7 ft) (update 06/19/22)
- Tallulah River drains an area of 184 sq miles in Rabun County. The flow near Clayton is normal 73.55% above mean at 126 cfs and 2.31 ft deep (flood stage is 20ft);
- at Terrora Powerhouse at Tallulah Falls the flow is unrated 85.61% above mean at 56.7 cfs and 2.14 ft deep;
- above Powerhouse near Tallulah Falls flow is, 99.83% above mean at 41.6 cfs and 5.17 ft deep (flood stage is 30 ft) (update 06/19/22)
- Broad River drains an area of 1420 sq feet in Elbert and Madison Counties. The flow above Carlton in Madison County is normal, 56.77% above mean at 457 cfs and 3.04 ft deep (flood stage is 15 ft); the flow near Bell in Elbert County is below normal, 47.81% above mean at 539 cfs and 4.30 ft deep (flood stage is 21 ft) 06/19/22
Savannah River
drains an area of 9850 sq miles from Columbia County to Effingham County. The flow:
- near Evans in Columbia County is 17.06 ft deep;
- at Jefferson Davis Bridge near Augusta in Richmond County 14.42 ft deep;
- at Augusta is normal,78.67% above mean at 5880 cfs and 99.35ft deep (flood stage is 117.5 ft);
- near Waynesboro in Burke County is 117.05% above mean at 6880 cfs and 9.13 ft deep;
- at Burtons Ferry near Millhaven in Screven County is normal, 85.75% above mean at 6890 cfs and 6.82 ft deep (flood stage 15 ft);
- at Cylo in Effingham County flow is normal, 77.85% above mean at 7560 cfs and 5.52 ft deep (flood stage 11 ft);
- above Hardeeville SC 4.59 ft deep;
- near Port Wentworth in Effingham County is -6770 cfs and 3.30 ft deep;
- at USACE Dock in Savannah is -63400 cfs and 3.44ft deep, temp 28.8°C. (update 06/19/22)
Groundwater Monitoring Station
- Richmond County Groundwater station ID#2001 water level is trending upwards, 43.54 ft below surface as of April 6th 2022.
5b Ogeechee River Watershed
The Ogeechee is a free-flowing blackwater river draining an area of 5540 sq miles entirely inside the state of Georgia. The North and South Fork Ogeechee Rivers (not monitored) come together to form the Ogeechee, which flows 245 miles and empties in the Atlantic.
- Black Creek drains an area of 232 sq miles of Bryan County. The flow near Blichton is above normal: 1.19% above mean at 1.25 cfs and 2.37 ft deep (flood stage is 18 ft) (update 05/12/22)
- Ogeechee River drains a combined area of 5540 square miles in Jefferson, Screven, and Counties. The flow
- at GA 88 near Grange in Jefferson County is: 35.41% above mean at 38.9 cfs and 6.80 ft deep (flood stage is 18 ft);
- at Midville in Burke County is: 25.49% above mean at 152 cfs and 0.14 ft deep (flood stage is 6 ft);
- near Rocky Ford Rd in Rocky Ford, in Screven County is normal: 21.62% above mean at 220 cfs and 2.79 ft deep(flood stage is 13 ft);
- at GA 24 near Oliver in County is flowing normal, 28.18% above mean at 293 cfs and 5.77 ft deep.
- near Eden is much below normal flow: 13.96% above mean at 180 cfs and 2.38 ft deep (flood stage is 11 ft);
- at GA204 near Ellabell, the flow is below normal: 27.29% above mean at 424 cfs and 3.82 ft deep (flood stage not given);
- at US17 near Richmond Hill tidal outlet in Bryan County, flow is -8110 cfs at 1.12 ft deep. (update 06/19/22)
Groundwater Monitoring Station
- Byran County Groundwater station ID#4301 water level is trending upwards, 60.47 ft below surface as of May 22,2022.
Report Key
Flows: WTGA reports systems with flows rated “much above normal” or “high” in bold text each week; flows in action stage or flood stage will appear in red. Data is gathered for selected sits in each watershed region, as recorded in the USGS WaterWatch real time streamflow monitoring system.
Monitoring stations vary as to data collected. Certain stations report flow depth and flood stage only; others included in this report show the variability of flow, with a rating of low, normal, above normal, much above normal or high. Measured flow in the top ten percent highest flows on record for that site (above 90th percentile, much above normal, and high values) appear in bold type. Flows at action stage or flood stage appear in red.
Water quality parameters are detected at certain sites, including temperature (°C) and specific conductance (µS/cm). Specific conductance is an important measurement of water quality. This is a measure of the way that electrical current moves through the water; any change in this number is an early warning of changing contaminant loads. The conductance measurement taken by USGS is temperature adjusted to 25°C, allowing for comparison of the specific value from week to week.
Lead can enter the drinking water stream when corrosion occurs with certain types of distribution lines and plumbing connections. Lead is toxic when consumed and accumulates in the body over time. The effects of lead toxicity may present from mild stomach upset to brain damage; lead is especially hazardous for children. Public Water systems sample and test for lead and copper at customer taps periodically throughout the year.
While there is no safe level of lead in drinking water, and the maximum non-enforceable target for drinking water is set to 0, the EPA requires action be taken when more than 10% of customers on a particular public drinking water system have lead at 15 parts per billion, or 0.015 mg/l, remedial action must be taken.
WTGA reports current year lead and copper test results, current year violations or enforcement orders for selected public drinking water systems as posted in EPA Georgia Drinking Water Watch. Accuracy of our report is limited to the accuracy of this source. For more information public drinking water systems classifications and terms, see database.